


Overview
What does the course cover?
Excel 2016 Pivot Tables provide a powerful way to summarise and report on vast amounts of Data. You’ll learn in detail how Pivot Tables work and the structure that must be followed to create useful reports and charts. This course is vital to gaining the most from this powerful feature of Excel.

Aims
Why take this course?
This course covers the use of Pivot Tables and Pivot Charts, one of the most powerful data analysis tools available in Excel. If you need to work with databases or tables in Excel and report on that data, chances are that Pivot Tables will provide the fastest way to report and build charts on that data.

Audience
Who would benefit?
Anyone using Excel unfamiliar with Pivot Tables who is working with lists of data, perhaps filtering or sorting that data. Pivot Tables provide a powerful interactive way to query the data and summarise the results quickly and easily.
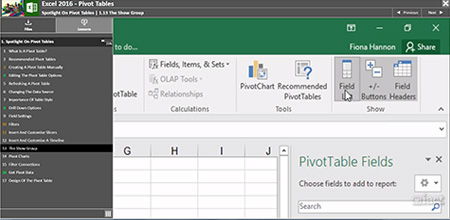
Course Preview
Each course contains high quality, professional video lessons, downloadable exercise files and real-world templates for you to use.
Course Details
Section 1: Pivot Tables
- Lesson 1: What is a PivotTable?
- Lesson 2: Recommeded PivotTables
- Lesson 3: Creating a PivotTable Manually
- Lesson 4: Editing the PivotTable Options
- Lesson 5: Refreshing a PivotTable
- Lesson 6: Changing the Data Source
- Lesson 7: Importance of Table Style
- Lesson 8: Drill down options
- Lesson 9: Field Settings
- Lesson 10: Filters
- Lesson 11: Insert & Customise Slicers
- Lesson 12: Insert & Customise a Timeline
- Lesson 13: The Show Group
- Lesson 14: Pivot Charts
- Lesson 15: Filter Connections
- Lesson 16: Get pivot data
- Lesson 17: Design of the PivotTable

Skills You’ll Learn
What you’ll be able to do after the course
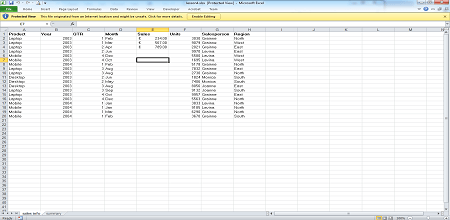
- Check source data to ensure it’s correctly organized for Pivot Table results
- Figure out which data to put in row, column or page areas
- Update or refresh the data in a pivot table when it is required
- Drill down into data using Pivot Slicer tool
- Work with the pivot slicer tool
- Use Pivot Action settings
- Use the new features available in Excel 2016

How You Can Apply These Skills
What you’ll be able to use these skills for
- Building summary reports from phone systems or accounts databases
- Build and format a pivot chart
- Summarizing sales based on sales person or region
- Calculating inventory levels and re-order quantities
- Use Pivot Charts to help make management decisions
- Analyse internet traffic statistics or Google reports
- Copy pivot charts into Word or PowerPoint
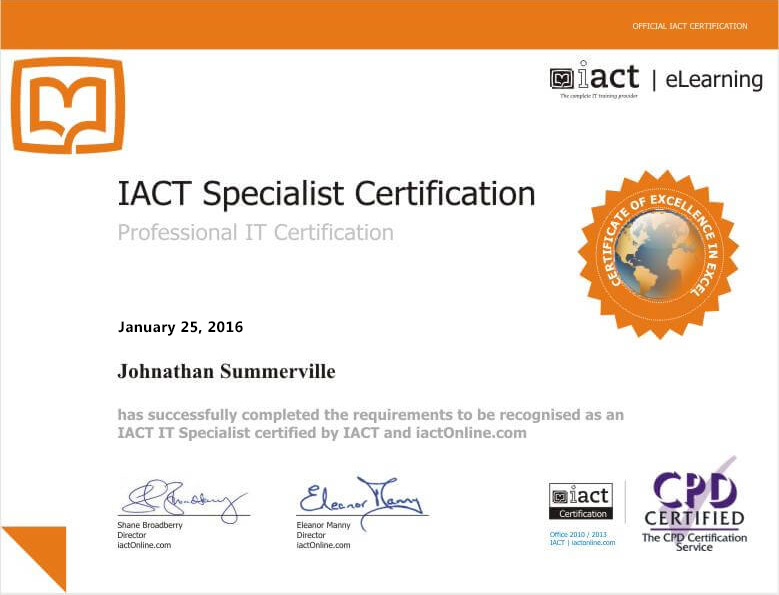
Certification
When you pass you will receive an internationally recognized accreditation certificate like this:

What’s next?
If you would like to learn more about Excel 2016, Macros, Charts and Formulas and Functions courses might also be of interest.

Careers that require these skills at this level?
Excel is used in practically every business and in nearly all departments in those businesses – ranging from sales to accounting and administration. Any finance role will require you to be proficient to this level.

Want to start learning today?
Joining is simple, easy and risk free with our 7 day money back guarantee.


